Are there more males or females in Singapore?
Try to guess. Are there more males or females in Singapore? What about across each ethnic group? Read on and compare your answers to the data provided by the Singapore Department of Statistics!
For all charts below, data before 1980 (except 1970) refer to the ‘total population’ (citizens, permanent residents, and non-residents), while data for 1970 and 1980 onwards refer to ‘residents’ (citizens and permanent residents).1
The chart below shows the number of males and females in Singapore, for each year from 1960 to 2017.
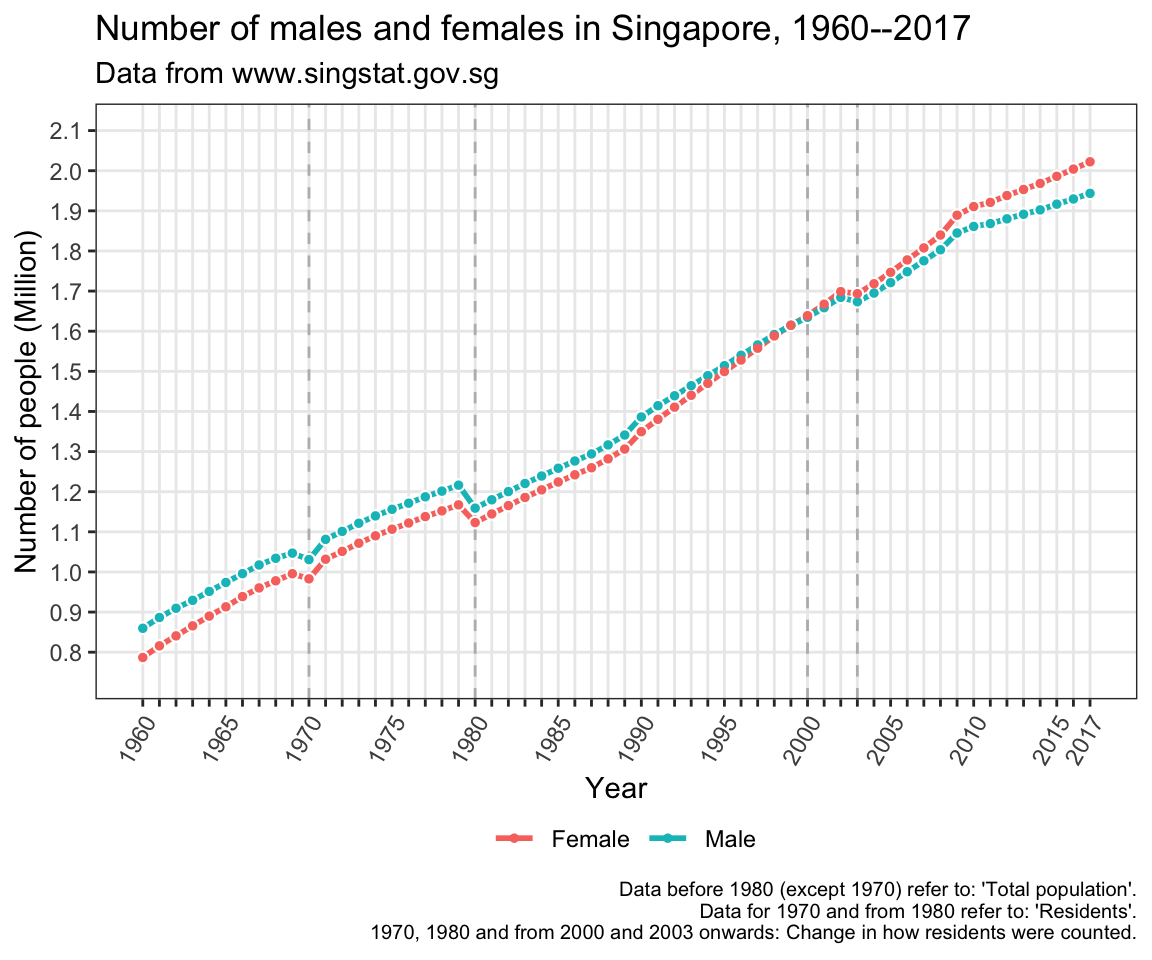
There were more males from 1960 to 1998. From 1999 to 2017, there were more females.
The number of females increased by an average (median) of 21,600 each year.
The number of males increased by an average (median) of 20,500 each year.
There were only 3 years where there was a drop in the number of males and females: 1970, 1980, 2003. This is likely due to the change in how residents were counted. For example, data for 1970 and 1980 refer to all residents present in Singapore on Census day.
- The biggest drop happened in 1980: there were 57,300 fewer males and 44,100 fewer females compared to the previous year, 1979.
The chart below shows the sex ratio of Singapore for each year from 1960 to 2017.
The sex ratio is the number of males for every 100 females. A sex ratio of 100 means there are 100 males for every 100 females (an equal number of males and females). A ratio above 100 means there are more males. A ratio below 100 means there are more females.
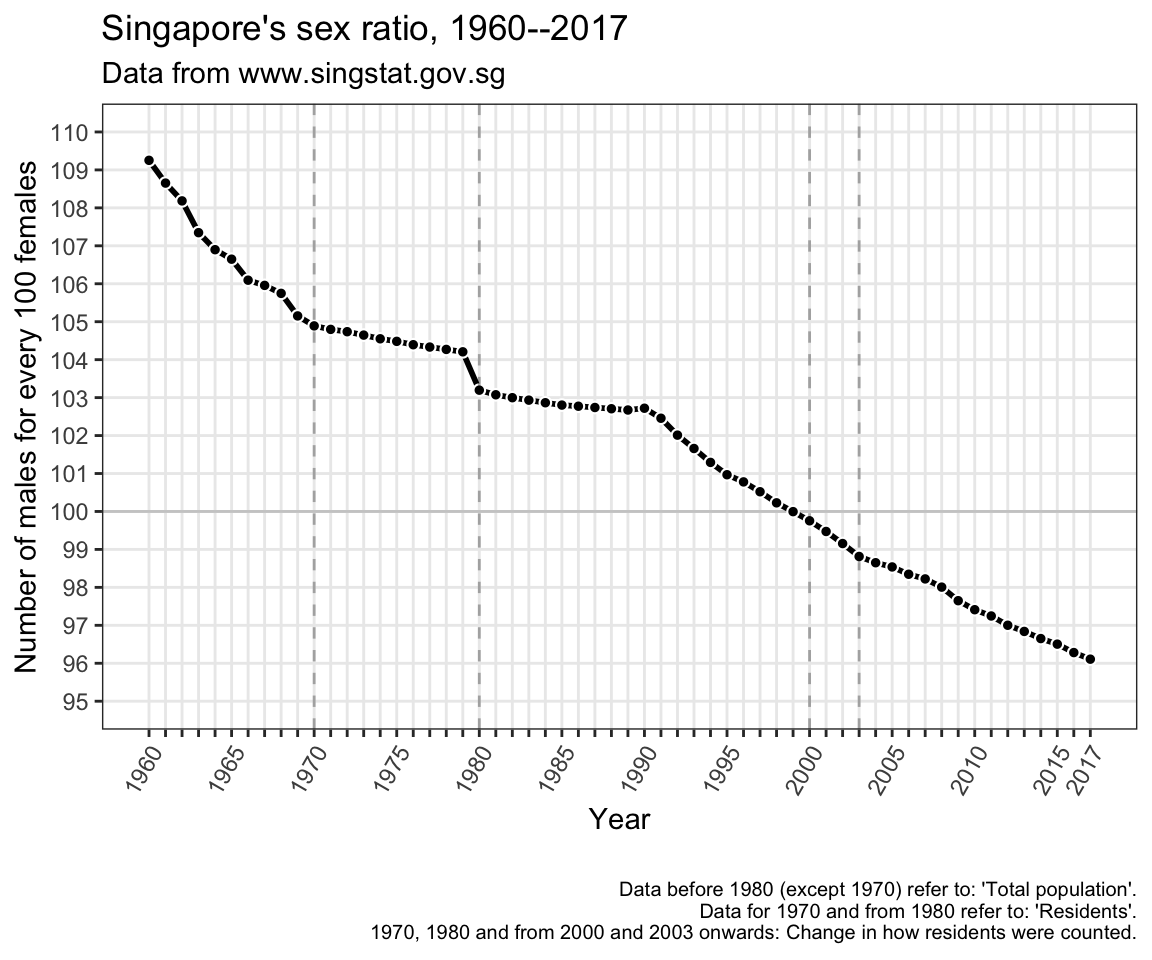
- There were around 109 males for every 100 females in 1960. The sex ratio tended to decrease each year to around 96 males for every 100 females in 2017.2
The chart below shows the sex ratio for each ethnic group, for each year from 1960 to 2017.
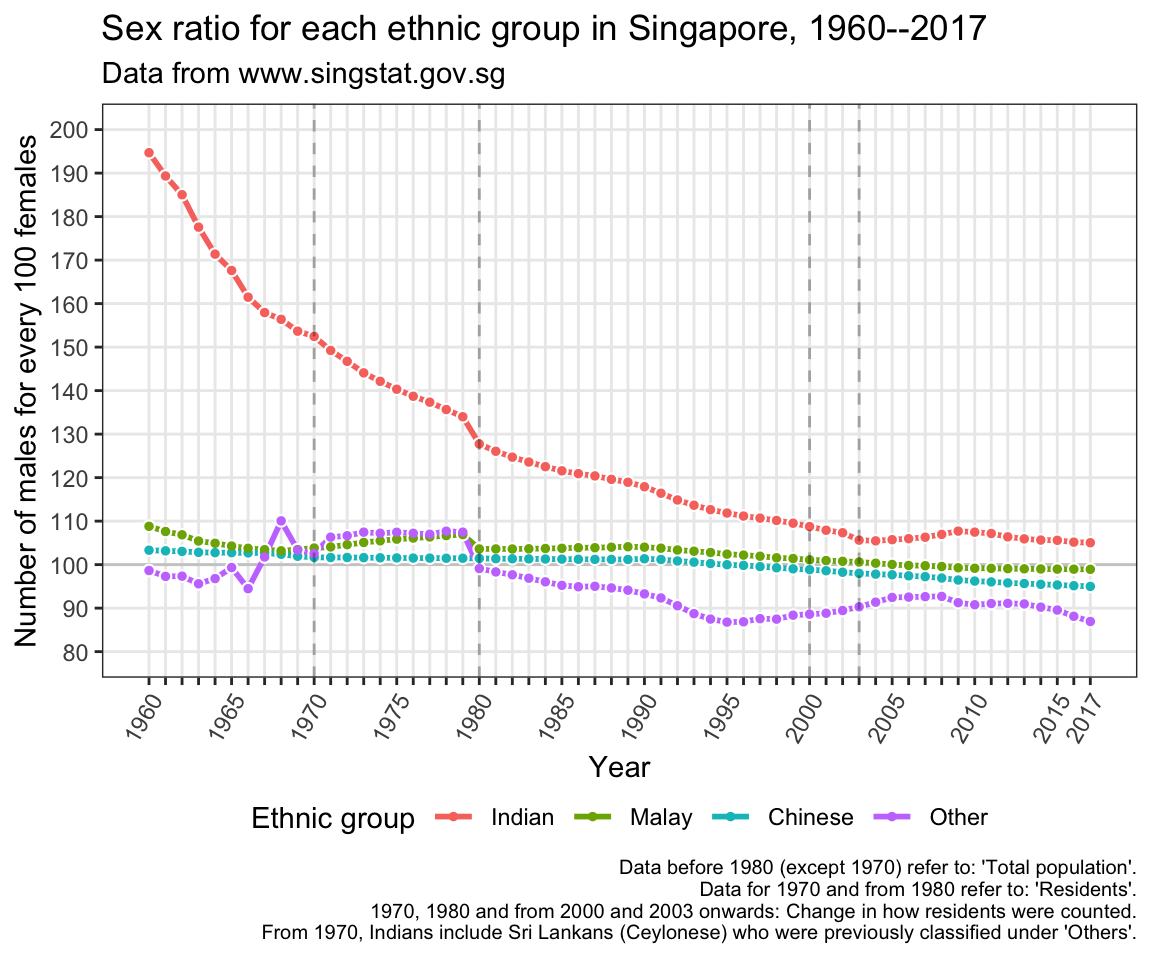
The sex ratio within each ethnic group tended to decrease over the years.3
Indians. In 1960, there were 195 Indian males for every 100 Indian females. In 2017, there were 105 Indian males for every 100 Indian females.
Malays. In 1960, there were 109 Malay males for every 100 Malay females. In 2017, there were 99 Malay males for every 100 Malay females. There was a visible increase in the sex ratio from 1969 to 1979.
Chinese. In 1960, there were 103 Chinese males for every 100 Chinese females. In 2017, there were 95 Chinese males for every 100 Chinese females.
Others. In 1960, there were 99 “Other” males for every 100 “Other” females. In 2017, there were 87 “Other” males for every 100 “Other” females. The sex ratio was highest in 1968 (110 “Other” males for every 100 “Other” females).
What could explain the change in Singapore’s sex ratio, especially in the last 10 years or so? Immigration could be one reason, according to an article in the Straits Times newspaper.4 Click here to read the Straits Times news article (pdf).
According to www.singstat.gov.sg: ‘Data for 1970 and 1980 refer to all residents present in Singapore on Census day. Data from 2000 onwards are based on the register-based approach. Data from 2003 onwards exclude residents who are overseas for a continuous period of 12 months or longer as at the reference period.’↩
The sex ratios were rounded to the nearest whole number.↩
The sex ratios quoted below for each ethnic group were rounded to the nearest whole number.↩
Rachel Lin. “Influx of women tilts Singpore’s sex ratio.” The Straits Times 04 September 2010. Accessed on 10 Dec 2017 from: http://lkyspp2.nus.edu.sg/ips/wp-content/uploads/sites/2/2013/06/ST_Influx-of-women-tilts-Singapore_040910.pdf.↩