The highest car prices in the world?
Singapore is the most expensive place in the world to own a car, according to a survey by the Economist Intelligence Unit. Currently, buying a new Toyota Corolla would cost around SGD $100,000 (~USD $75,000), and you can only own it for 10 years. After 10 years, you have to deregister and dispose your car or buy a Certificate of Entitlement to continue using it for another 5 or 10 years.
According to the Land Transport Authority of Singapore1,
Anyone who wishes to register a new vehicle in Singapore must first obtain a Certificate of Entitlement (COE), in the appropriate vehicle category. A COE represents a right to vehicle ownership and use of the limited road space for 10 years… COEs are released through competitive bidding. There are 2 bidding exercises every month.
When buying a new car, you have to obtain a COE and pay for the cost of the car. COEs are used together with a quota on the number of vehicles allowed on the roads to regulate the vehicle population growth2.
Using data from the Singapore government’s open-data initiative3, we can find out:
How much does a COE for a new car cost?
How many COEs are available?
The charts below show the cost of COEs for new cars in each bidding round every month, from January 2010 to August 2017. Each panel represents a different vehicle category.
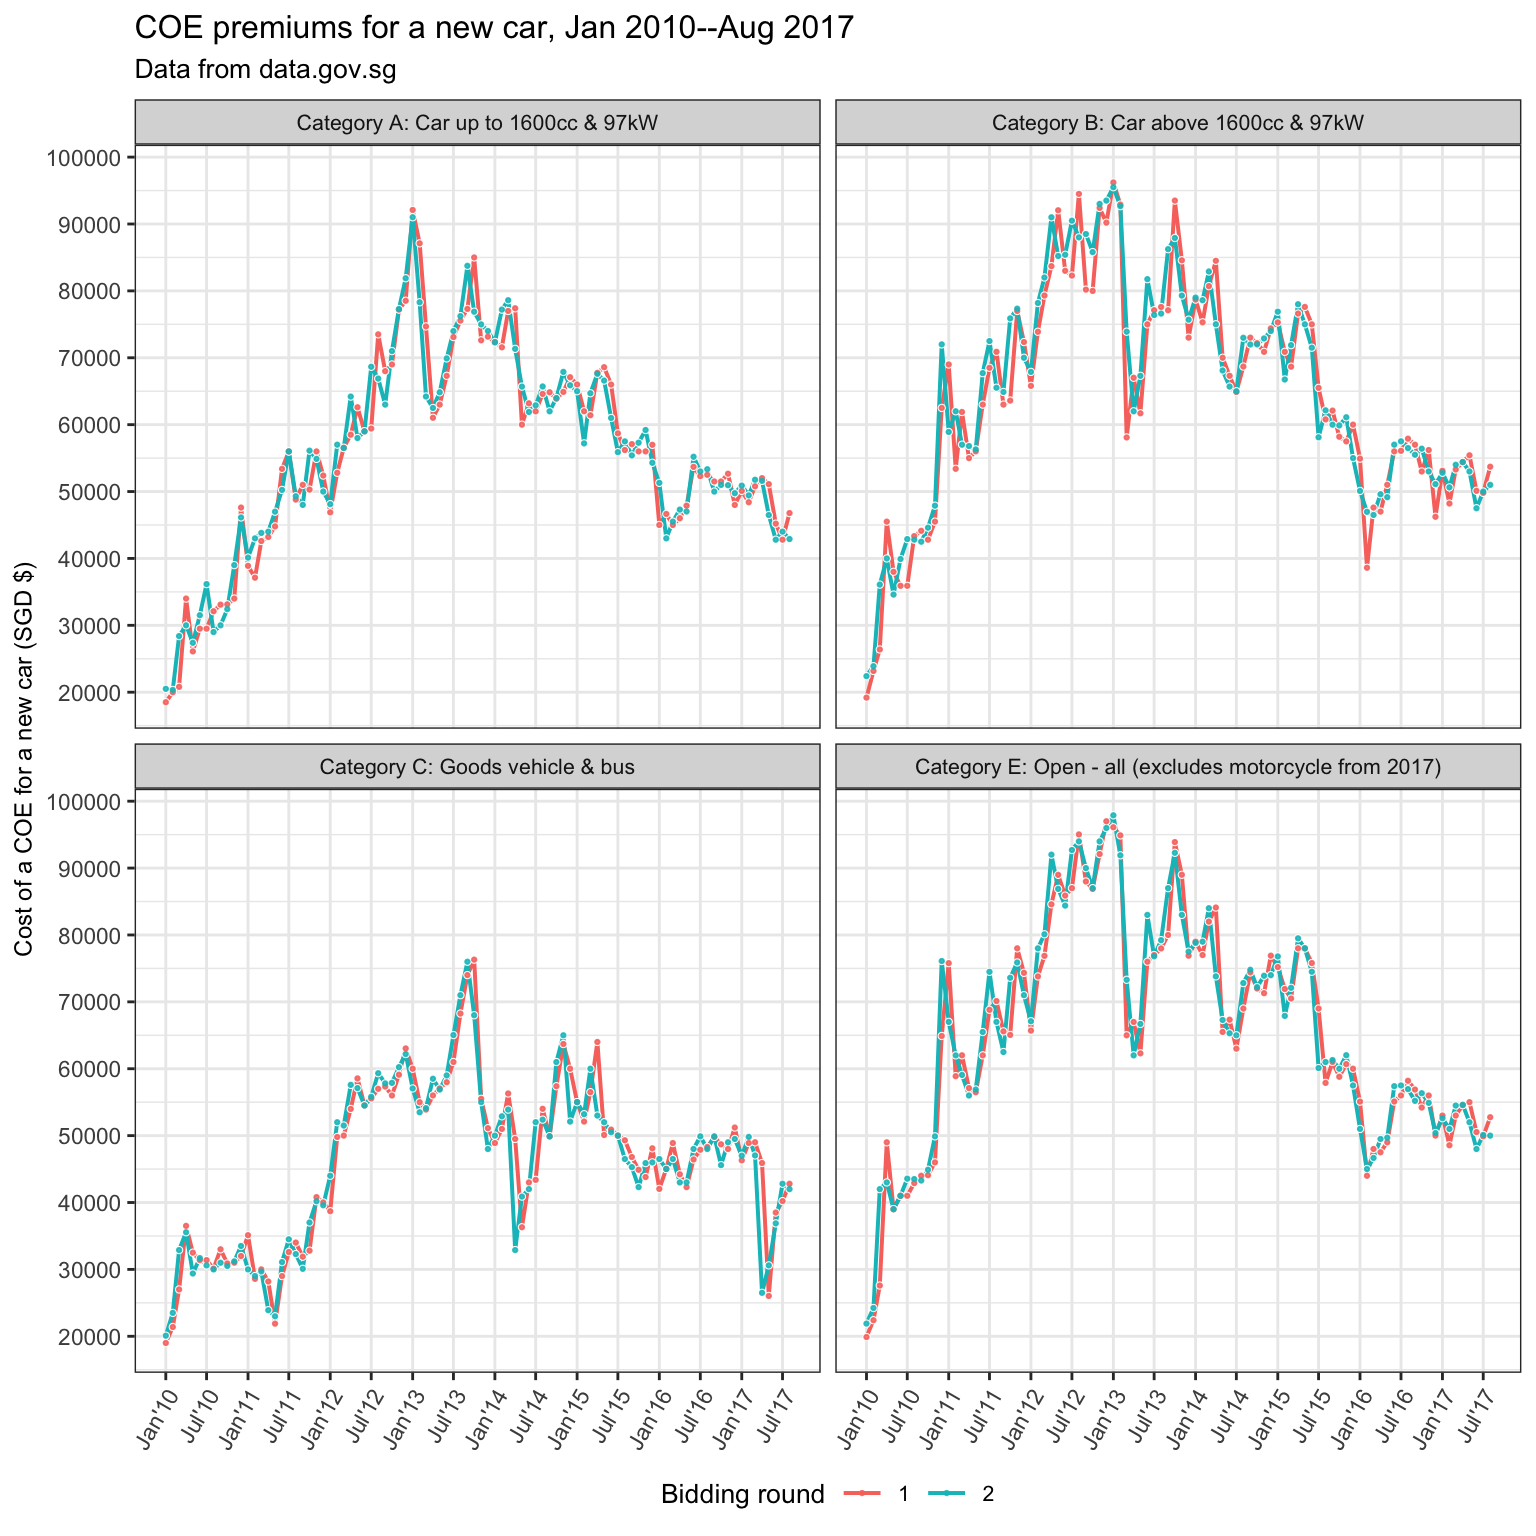
The cost of COEs tended to increase initially and then decrease after 2013, although there were were rather large fluctuations. The fluctations tended to be smaller after 2016.
The cost of COEs tended to be similar across each bidding round, with some notable exceptions. For example, see Category B just after January 2016, where the COE price in round 1 was noticeably lower than in round 2.
Categories B and E tended to have very similar patterns. The price of COEs for new Category B and new Category E cars tended to be very similar in each month.
The charts below show the number of available COEs for cars in each bidding round every month, from January 2010 to August 2017. Each panel represents a different vehicle category.
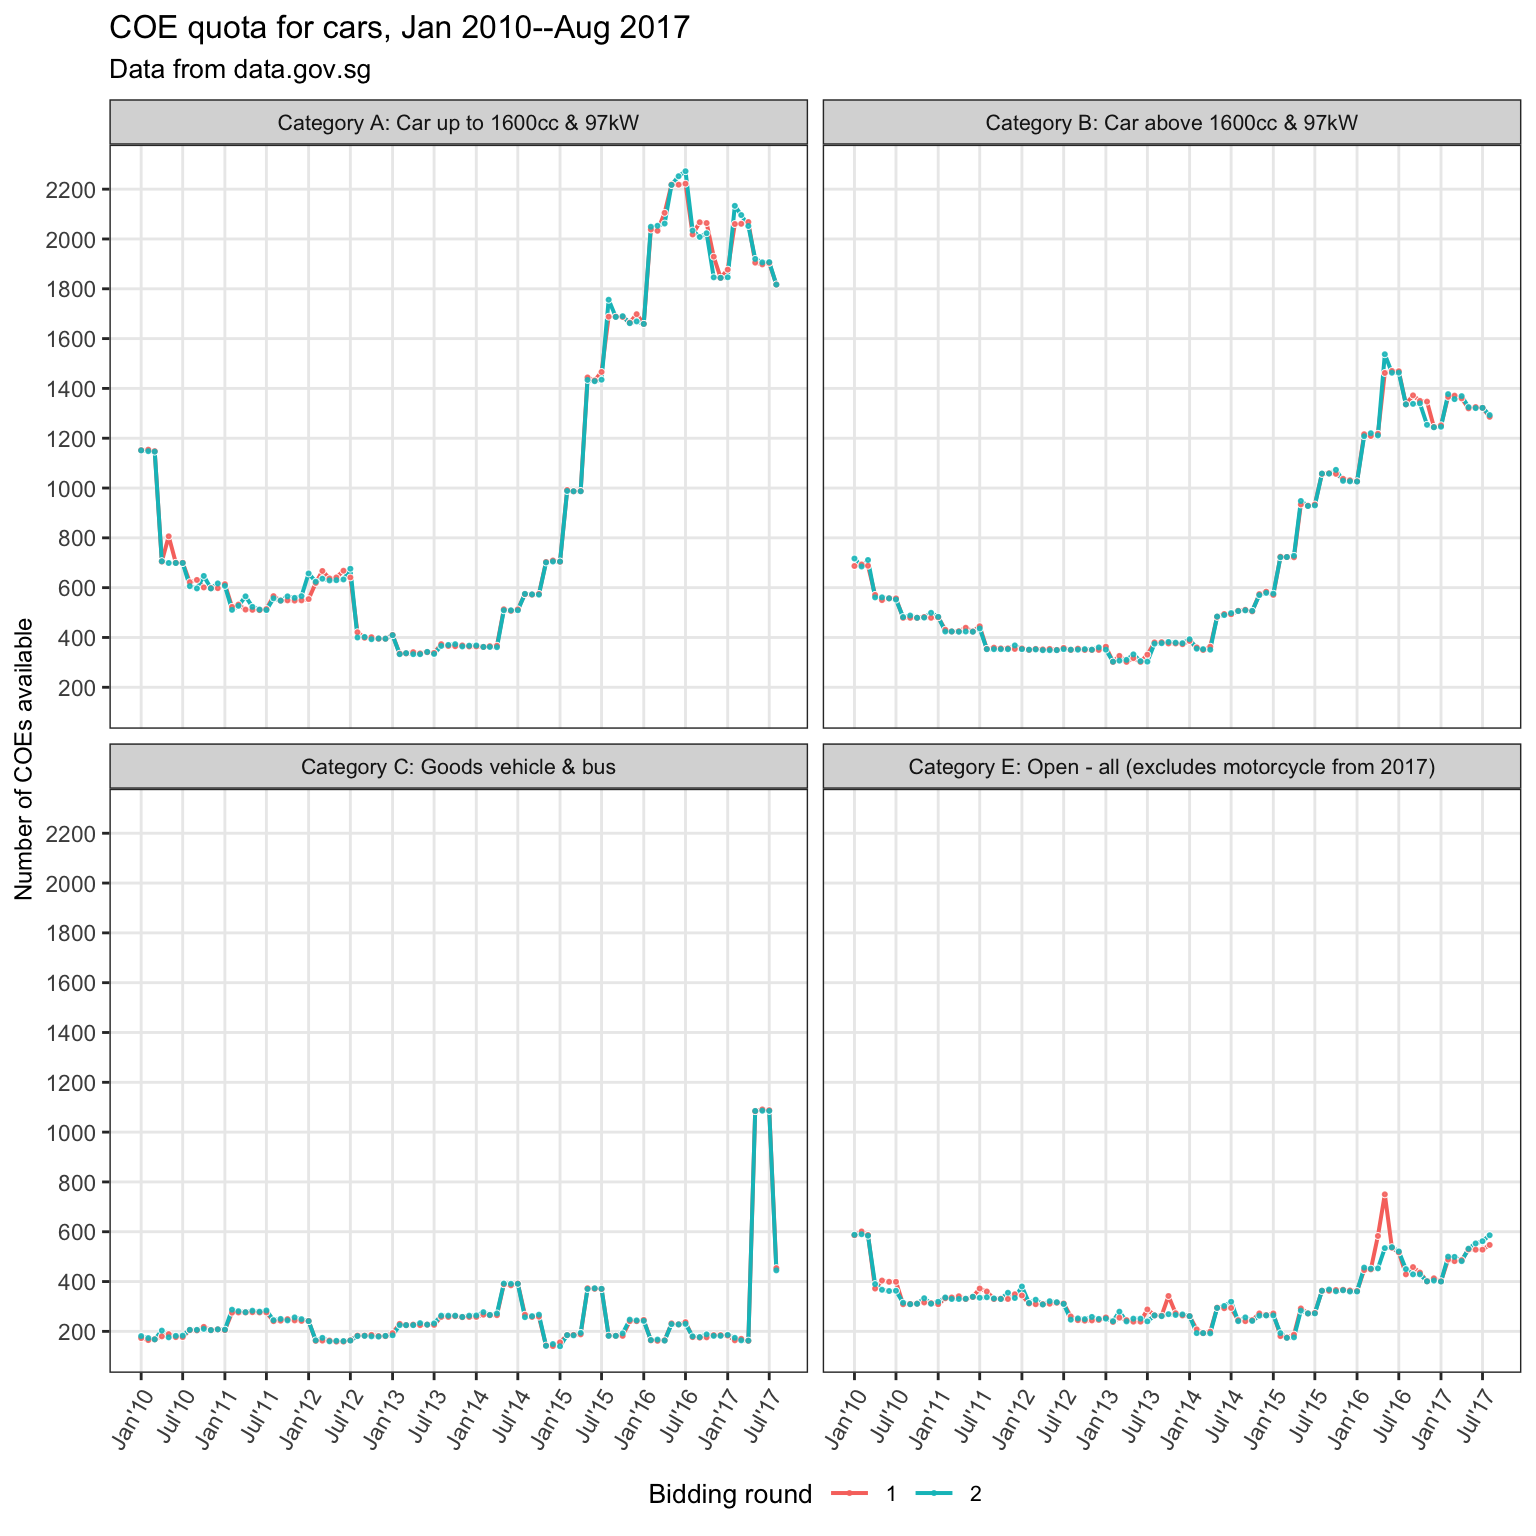
For each category, the number of available COEs tended to be very similar in each bidding round, with a few exceptions. For example, see the red spike in Category E, between January and July 2016.
Across categories, the trend in the number of available COEs was different.
There is an interesting pattern in Category C, from 2014 onwards. There is a jump from April to May. From May to July, it stays constant. Then, it falls in August. This pattern is most noticeable in 2017.